Fun with Mandelbrot sets
Rationale
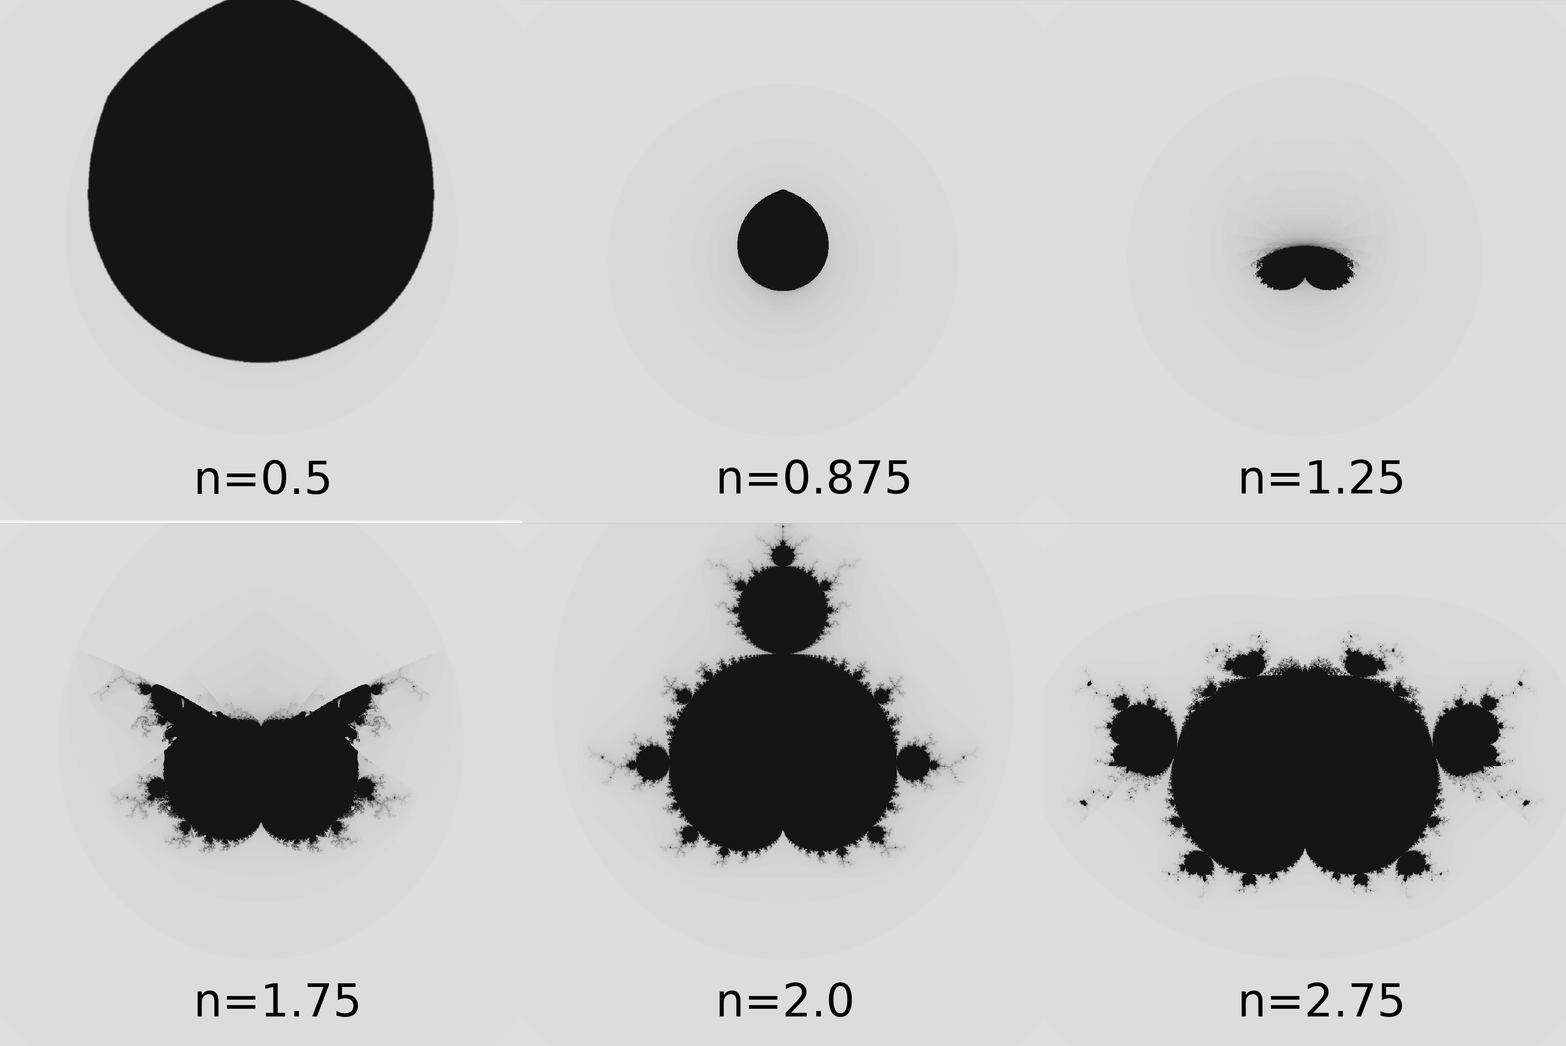
I have never visualized the Mandelbrot set myself, and I was curious about how changing the exponent would affect the behavior, so I went ahead and put together a small animation to show how the structue changes with an increasing exponent.
Background
The Mandelbrot set can be visualized by coloring the values of a complex parameter \(c\) by the number of iterations needed for the map \(z_{t+1}=z_{t}^n + c\) to converge to a specified cutoff. The idea is to find how long, i.e. how many iterations it takes to achieve \(z_{t+1}=z_{t}=z^*\), which I would like to think of as a steady state for the function. I am not quite sure what the intuition behind plotting the number of iterations is though.
Method
For the code below, I used the cutoff of 2.0, and the maximum number of iterations=100 for each value of \(c\). I was curious to see how it would behave for non-integer exponents, so I decided to generate the Mandelbrot sets for \(n=[0.5,2.725]\) in steps of 0.025.
import numpy as np
import matplotlib.pyplot as plt
from tqdm import tqdm


def mandelbrot(z,c,exponent):
    return(z**exponent+c)

XMIN=-1.5
XMAX=1.5
YMIN=-1.5
YMAX=1.5
XSTEPS=1000
YSTEPS=1000
exponent=2.725

Grid=[]
X=np.linspace(XMIN,XMAX,XSTEPS)
Y=np.linspace(YMIN,YMAX,YSTEPS)

for x in X:
    for y in Y:
        Grid.append((x,y))

print(len(Grid))

CUTOFF=2.0
NUMITER=100

Mandelbrot_value=[]

for g in tqdm(Grid):

    x,y=g
    c=np.complex(x,y)
    it=0

    z=0.0+0.0j
    SUCCESS=True

    while it<NUMITER:
        z=mandelbrot(z,c,exponent)
        if np.abs(z)>CUTOFF:
            SUCCESS=False
            break
        it+=1

    Mandelbrot_value.append(it)

minD=min(Mandelbrot_value)
maxD=max(Mandelbrot_value)

Output=[]
i=0
for x in X:
    row=[]
    for y in Y:
        row.append(maxD-Mandelbrot_value[i])
        i+=1
    Output.append(row)

plt.figure(figsize=(15,15))
plt.imshow(Output,cmap='viridis')
plt.show()

Let me know what you think!


