


What is the relationship between model size and number of parameters?
A question that came up in a lab meeting recently was how does the number of parameters grow with the size of the model. I currently use the Standard Component Modeling strategy in my model, and there has been almost no rigorous analysis (to the best of my knowledge) that compares the number of parameters required in mass-action kinetics formulation of a given model versus, say, an SCM formulation.
To get a rough idea about this trend, I wanted to simply plot the number of paramters against the number of variables from different models. I used the manually curated models from Biomodels for this comparison.
To download the SBML files of the models, I used this hacky script:
import wget
from tqdm import tqdm
for i in tqdm(range(0,625)):
    if i<10:
        f=wget.download("https://www.ebi.ac.uk/biomodels-main"
	"/download?mid=BIOMD000000000"+str(i),"./sbml-files/")
    if i>=10 and i<100:
        f=wget.download("https://www.ebi.ac.uk/biomodels-main"
        "/download?mid=BIOMD00000000"+str(i),"./sbml-files/")
    if i>=100 and i<1000:
        f=wget.download("https://www.ebi.ac.uk/biomodels-main"
	"/download?mid=BIOMD0000000"+str(i),"./sbml-files/")
Once I had the roughly 625 SBML files (which took about 15 minutes), I used the libSBML module to read and extract the number of parameters and species from each model using something like this:
import libsbml as lsb
import matplotlib.pyplot as plt
PATH='./sbml-files/'
ListVals=[]
for i in tqdm(range(1,625)):
row=[]
reader = lsb.SBMLReader()
if i<10:
document = reader.readSBML(PATH+"BIOMD000000000"+str(i)+".xml")
if i>=10 and i<100:
document = reader.readSBML(PATH+"BIOMD00000000"+str(i)+".xml")
if i>=100:
document = reader.readSBML(PATH+"BIOMD0000000"+str(i)+".xml")
model=document.getModel()
Pval=model.getListOfParameters()
Sval=model.getListOfSpecies()
plt.plot(Sval.__len__(),Pval.__len__(),'k.')
row.append(Sval.__len__())
row.append(Pval.__len__())
ListVals.append(row)
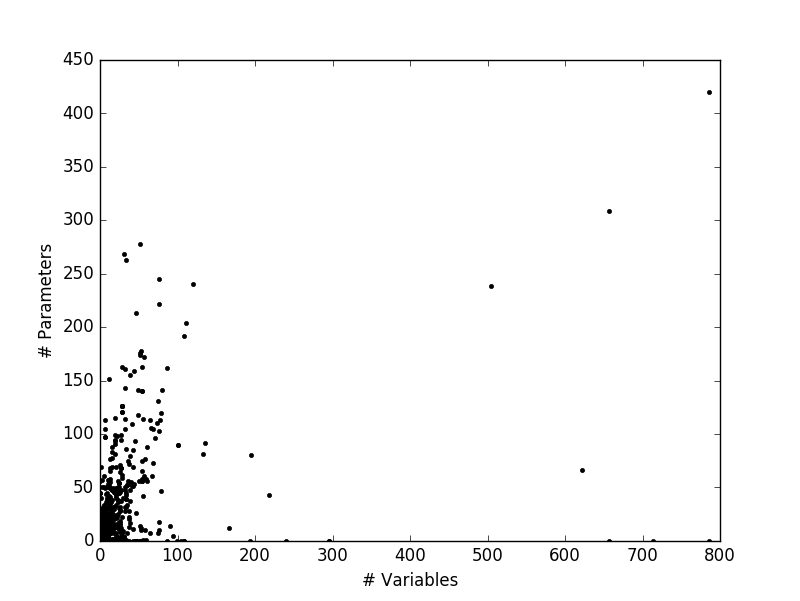
plt.show()The resulting plot was a little surprising. For one, the largest model seemed to have about 800 variables, which I am curious about. Also, there are evidently problems with this SBML parsing, because a large number of models seem to lie on the abcissa with no parameters.
To make more sense of this data, I went one step ahead and tried to get a linear fit to this data. For this, I cleaned up the data by removing points that lie on the axes. Also, I stuck to models with around 150 variables as the upper limit to represent a ‘typical’ model.
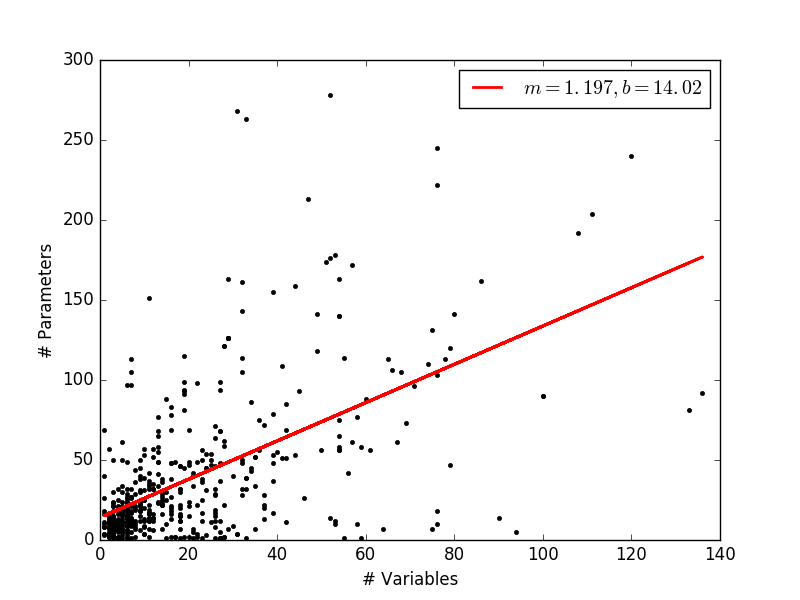
This is rather surprising, because I had expected the parameter size to increase rather drastically as the model size increases. The overall trend in a general increase in parameter number, but it really looks like the modelers like to keep their paramters to the minimum. This definitely calls for a closer look at the statistics!