


Scripts to generate graphic summaries of weekly org-reports
Generate Graphics for org-reports
My lab uses toggl for clocking tasks. I find it convenient to work out of emacs and org-mode, and find it annoying to keep shuttling between the browser and back to clock tasks. Moreover, with org-capture, clocking in and out is a piece of cake, so why wouldn’t I use it?
The only thing that toggl does that org-mode doesn’t, is to generate fancy summary graphics for the clocked hours. I decided to fix that using a little bit of shell and python. These scripts create a weekly summary with bar plots for effort per day and pie chart showing cumulative effort. Feel free to modify and use them for your own purposes!
All scripts mentioned here can be found here.
Let me know if the following instructions are unclear, and I’ll try to fix them!
- Create an org-file called export-reports.org. This file will contain the org-report tables for all your tags.
- Creating org-report tables:
- Assuming you have agenda files where you clock your effort with appropriate tags for tasks, create the following environment for ech tag that you want to generate a report for:
-
Notice that you have to modify 3 variables, the NAME of this table, the SCOPE that has to point to agenda file(s) and the TAGS. If you want to include multiple tags in a single report, use | as the OR logic for including tags. Alternatively if you want to specify combinations of tags you can use the ‘&’ logic to separate tags.
#+NAME: tagname
#+BEGIN: clocktable :maxlevel 4 :scope ("~/path/to/agenda/file.org") :block thisweek :tags "tagname"
#+END:
As an example, I have a tag work that encompasses all research-related tasks, for which I have a single agenda file ~/orgs/diary.org , hence I will use the following table:
#+NAME: work
#+BEGIN: clocktable :maxlevel 4 :scope ("~/orgs/diary.org") :block thisweek :tags "work"
#+END:
- Once you create such environments for every tag that you want to include in the report, move the cursor to each environment and generate the report for that tag using the key combination
C-c C-x C-u. This will update the clock table. -
In the same folder as your export-orgs.org file, add the following .el file (source: https://emacs.stackexchange.com/a/16883)::
(require 'org) (defun my-tbl-export (name) "Search for table named `NAME` and export." (interactive "s") (show-all) (let ((case-fold-search t)) (if (search-forward-regexp (concat "#\\+NAME: +" name) nil t) (progn (next-line) (next-line) (next-line) (org-table-export (format "%s.csv" name) "orgtbl-to-csv")))))` - Next, copy the org-report-processing.sh and generate-org-report.py into the desired location. Modify the path to the export-report.org folder in both scripts.
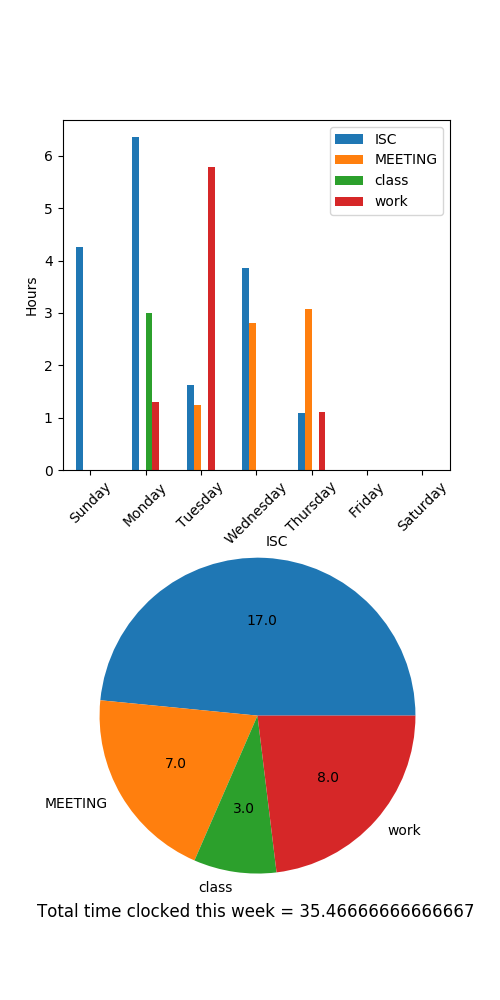
- Finally, simply run the shell script! This parses the export-report.org file and generates a list of tags, stored in tags.txt. Further, the elisp file is used to export all the report tables as individual .csvs. These files are read by the python script which finally generates plots summarizing the efforts. You should end up with something that looks like this:
- Get to work!